
Basics of Python Programming for Pharmaceutical Sciences
Python fundamentals — data types, control structures, functions and libraries such as NumPy and Pandas; handling and visualising pharmaceutical and biological data; computational thinking for pharmacy applications.
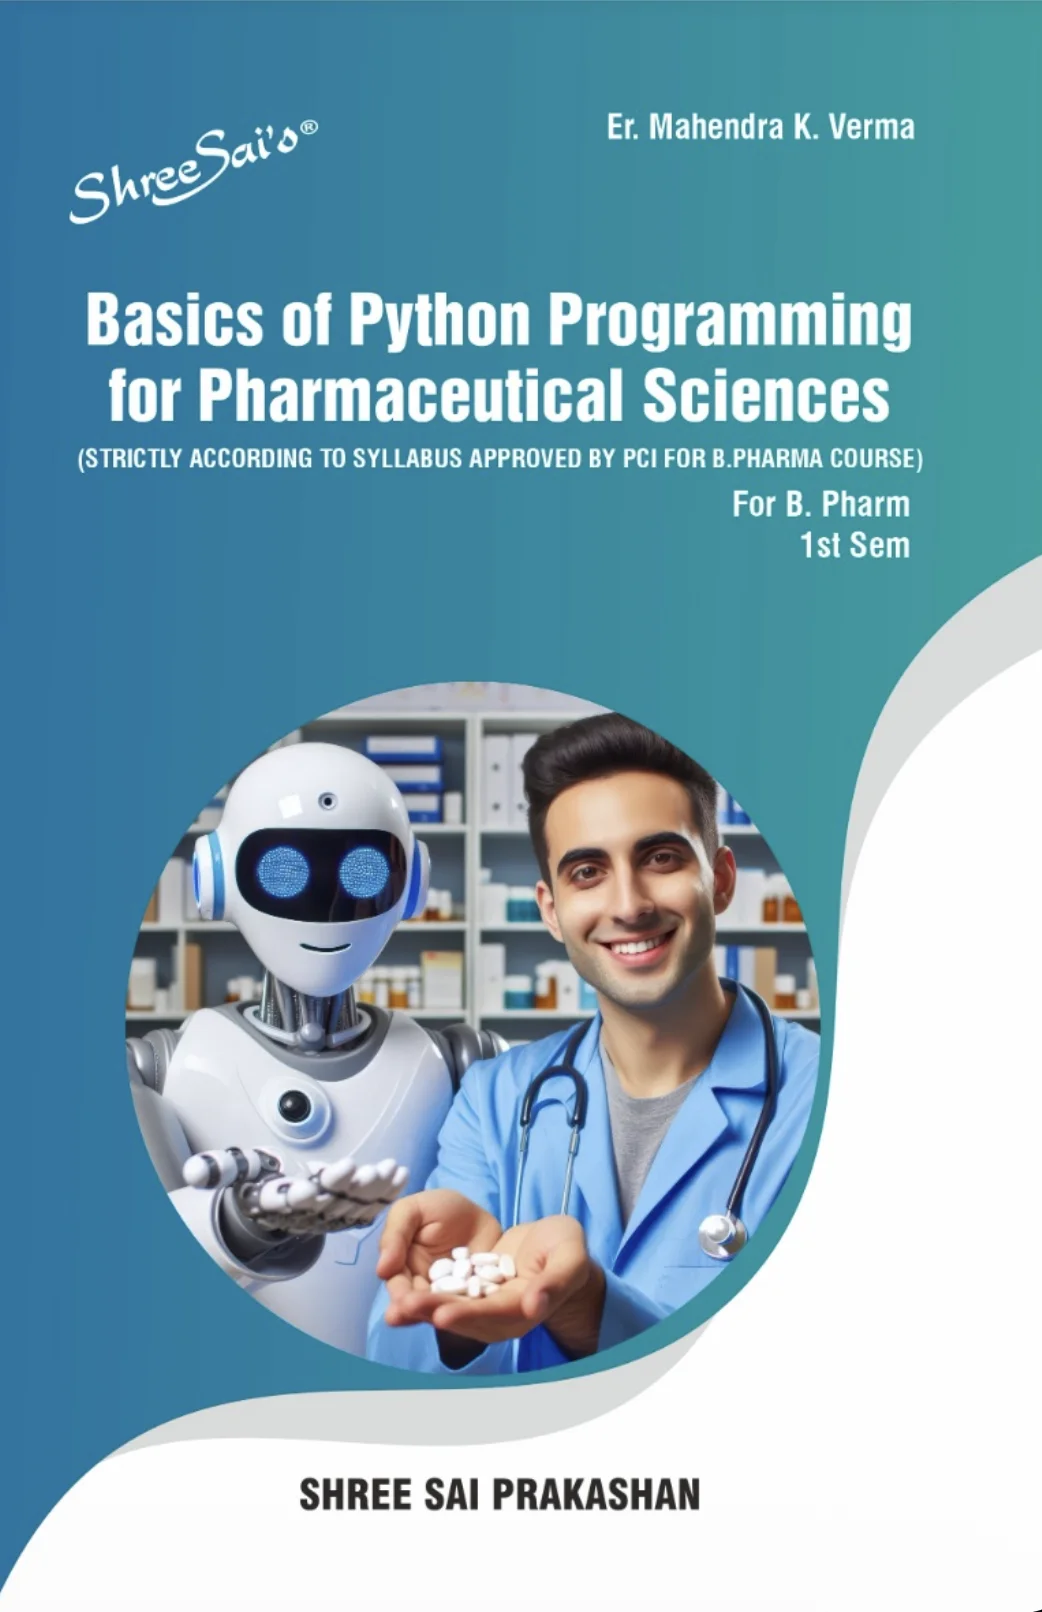
Basics of Python Programming for Pharmaceutical Sciences
The full NEP 2020 book from Shree Sai Prakashan — see full details, ISBN and syllabus coverage on the book page and buy there, or read Unit 1 free first.
Course contents — unit by unit · PCI NEP 2020 BP101T
Unit 1 · Introduction to Python Programming 6 hrs
Installing Python and an IDE (Jupyter Notebook, PyCharm, VS Code) and the advantages of IDEs over text editors; variables and data types (integers, floats, strings, booleans), type casting and operators (arithmetic, comparison, logical); input and output operations; basic string operations; and installing and using standard and third-party libraries.
Unit 2 · Control Structures & Functions 6 hrs
Conditional statements (if, if-else, if-elif-else and nested conditions); loops (for and while) with break and continue; defining and calling functions, passing arguments and returning values; and writing modular programs for simple pharmaceutical tasks such as dosage and BMI calculation.
Unit 3 · Data Structures & File Handling 6 hrs
Lists, tuples and dictionaries with indexing and slicing; string-manipulation techniques; an introduction to NumPy arrays (creation and arithmetic operations); reading and writing CSV files; and importing and manipulating small, structured healthcare datasets.
Unit 4 · Data Handling with Pandas 6 hrs
The Pandas library — Series and DataFrame structures; reading CSV and Excel files such as PK-study datasets and ADR reports; inspecting data with head(), tail(), info() and describe(); cleaning data and handling missing values; and filtering, selecting, grouping and aggregating data.
Unit 5 · Data Visualization with Matplotlib 6 hrs
Creating line plots, histograms, scatter plots and box plots with labelled axes, titles and legends; and visualising pharmaceutical datasets — concentration–time curves for oral and IV administration, ADR reporting rates, and dissolution profiles — with scientific interpretation of the plots.
← Full B.Pharm First Year syllabus All 8 semesters — B.Pharm NEP 2020 syllabus →
Adopting the new NEP 2020 B.Pharm syllabus?
Pre-book new-syllabus B.Pharm sets at institutional pricing.